Grade 8 Science: Rubber Band


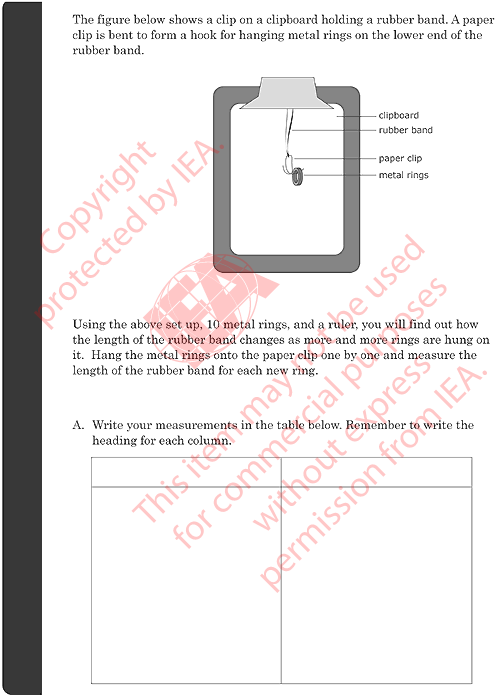
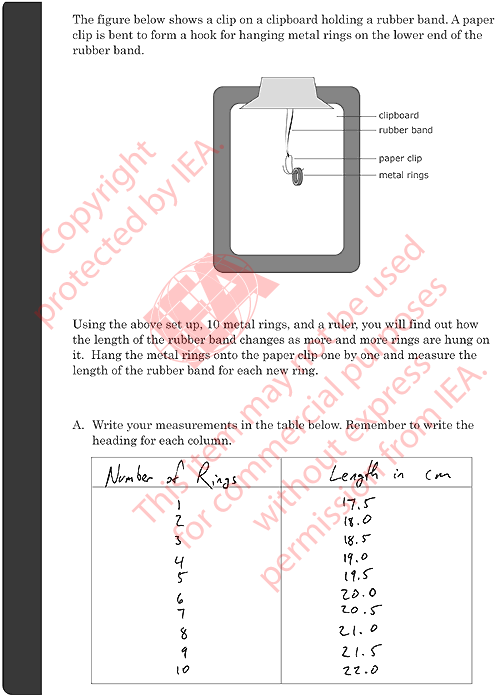
A1: Record Rubber Band Length as Rings Are Added
Correct Response for Quality of Presentation
- Following three criteria is met:
- Presents at least two sets of measurements in table.
- Measurements are paired: number of rings and length of rubber band.
- Labels table appropriately: data entries in columns identified by headings and/or units; units incorporated into headings or placed besides each measurement.
Partial Responses
- All criteria except #3 is met, some labels missing or incorrect.
- Records verbal rather than numerical observations in the table.
- Other partially correct.
Incorrect Responses
- Two or more measurement recorded but masses and lengths are not paired. For example, number of rings is not recorded.
- Other incorrect
A2: Record Rubber Band Length as Rings Are Added
Correct Response for Quality of Data
- Following two criteria is met:
- Records length of rubber band for five or more different numbers of rings.
- Shows reasonable trend in data: rubber band length increases with number of rings (at least for first few measurements); length may increase steadily at first and then stabilize or level off; elastic limit of rubber band may be exceeded and measurements toward the end show very large or erratic increases.
Partial Responses
- 3-4 measurements recorded; other criteria is met.
- Correctly records changes in length from the original length; i.e., takes original length as 0 point and then measures lengths with each added ring.
- At least 5 sets of measurements recorded, but pattern not reasonable; for example, data go the wrong direction.
- 3-5 data entries, but only increments in length recorded, not actual length of rubber band.
- Only two sets of measurements recorded, increases are reasonable.
- Other partially correct
Incorrect Responses
- Rubber band lengths do not increase even at the beginning.
- Other incorrect
Grade 8 Science: Rubber Band


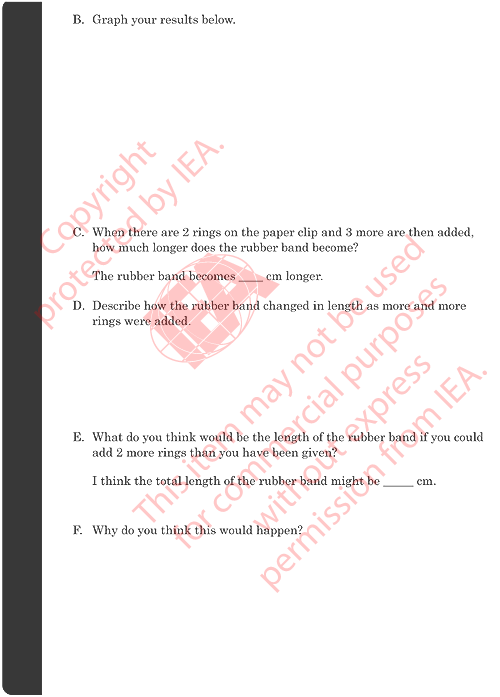
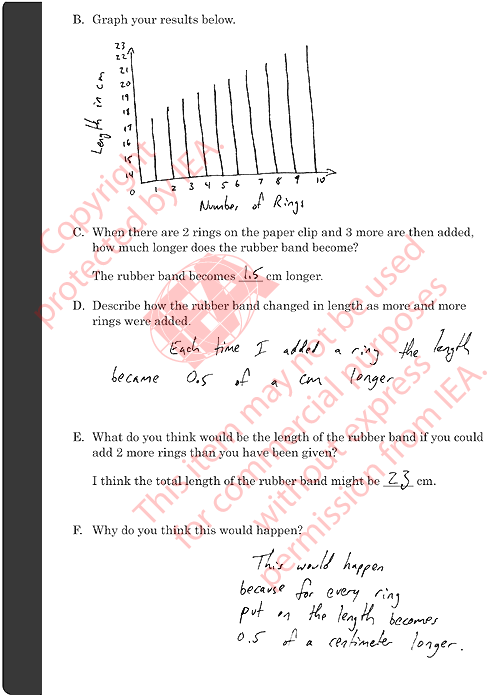
B: Graph Results (Graph or Bar Chart)
Correct Response
- Following four criteria is met:
- Axes correctly scaled.
- Axes correctly labeled, including units where appropriate.
- Measurements recorded in graph are consistent with data table.
- Graph reflects trend in data.
Partial Responses
- Labels for one axis are missing. Other criteria is met.
- Some measurements do not match data in table but trend in data is reflected in graph. Other criteria is met.
- Scaling incorrect. Other criteria is met.
- Graphs increments rather than overall length. Meets other criteria.
- Graph or bar chart incomplete; trend in data partially shown.
- Other partially correct.
Incorrect Responses
- Graph does not reflect the measurements in the table.
- Graph or bar chart presented, but is seriously inaccurate or incomplete.
- Other incorrect
C: Calculate Increase in Length of Rubber Band When Rings Are Added
Correct Response
- Following four criteria is met:
- Records amounts consistent with data in table, graph, or bar chart.
- Calculates increase correctly.
Partial Responses
- Calculation correct but based on an error in reading table.
- Other partially correct.
Incorrect Responses
- Actual length of rubber band given rather than subtracting 2 entries to obtain increase in length.
- Contains error in calculation.
- Merely repeats information in stem or in a previous question.
- Other incorrect
D: Describe How Rubber Band Length Changes as More Rings Are Added
Correct Response
- Following four criteria is met:
- Description corresponds to data in table or graph.
- Identifies trend in data. Trends are expressed quantitatively or qualitatively using descriptions trend may show that rubber band length increases consistently with each added ring; initially rubber band length increases consistently, then begins to level off; increases become larger or erratic with more rings (elastic limit of band exceeded); no change in length occurs (rubber band too strong for weights).
Partial Responses
- Corresponds to the data in the table, changes in length mentioned, but pattern of change in the length not addressed.
- Other partially correct.
Incorrect Responses
- Response describes something other than changes in length or patterns of increases.
- Merely repeats procedure or part of stem.
- Other incorrect
E: Predict Increase in Length of Rubber Band
Correct Response
- Following criteria is met: Makes responsible prediction, based on the data presented in the table or graph.
Incorrect Responses
- Answer not consistent with data.
- Records increment in length of rubber band instead of total length as required.
- Merely repeats information in stem or in a previous question.
- Other incorrect
F: Explain Reason for Prediction
Correct Response
- Following four criteria is met:
- Refers to the increase in length as read from the table or extrapolated from graph.
- Attempts to relate weight or number of rings to elasticity of the rubber band.
- Response is consistent with data in table or graph.
Partial Responses
- Answer consistent with data but explanation not quantitatively related to actual experimental measurements.
- Describes method of arriving at the answer, such as extrapolation from table or graph.
- Other partially correct.
Incorrect Responses
- Makes some sense but is not consistent with experimental data.
- Descriptive rather than explanatory response. For example it describes the experiment but fails to answer the question "why."
- Other incorrect
|
|
© 2008 International Association for the Evaluation of Educational Achievement (IEA)


